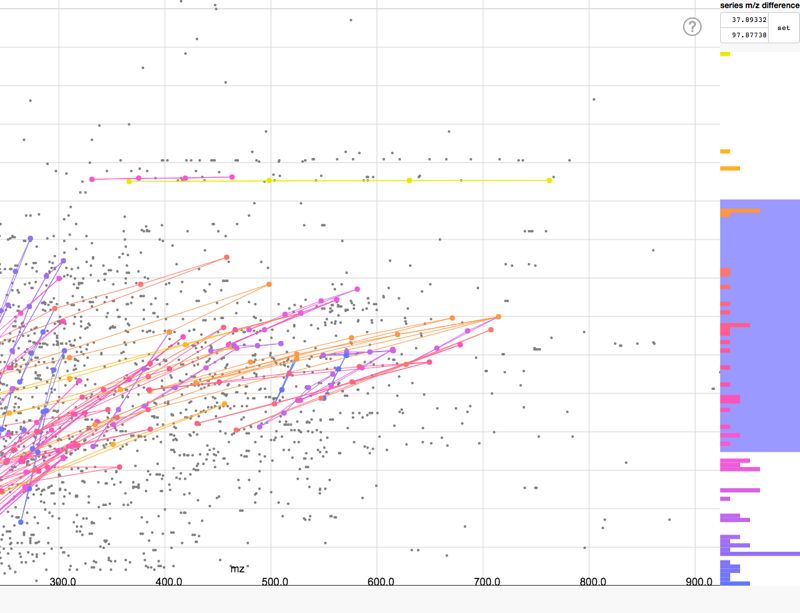
Welcome to the homologous series detection tool of Eawag Dübendorf. This online tool allows you to both detect and interactively explore signal patterns in liquid-chromatography (LC) mass spectrometry (MS) data that can be caused by the presence of homologous series compounds in a LC-MS measurement. Such signal patterns appear as signal series with almost constant MS mass differences and smooth changes in the LC retention time. Read the below instructions carefully to get the most of the tool and to avoid false or no results.
To use this tool, you must upload your LC-MS data as a .csv formatted file (left-handed sidebar). In such a file, each row represents a distinct (i.e., picked) LC-MS signal peak. In turn, the three columns in such a file represent the mass-to-charge ratio (m/z), the measured intensity and the retention time (RT) of each peak, respectively. Note that intensities are not involved in the detection procedure; dummy values are thus allowed; the column must however not be missing. Please compare with the provided example peaklist.
In addition, at least five parameters must be specified prior to running the algorithm:
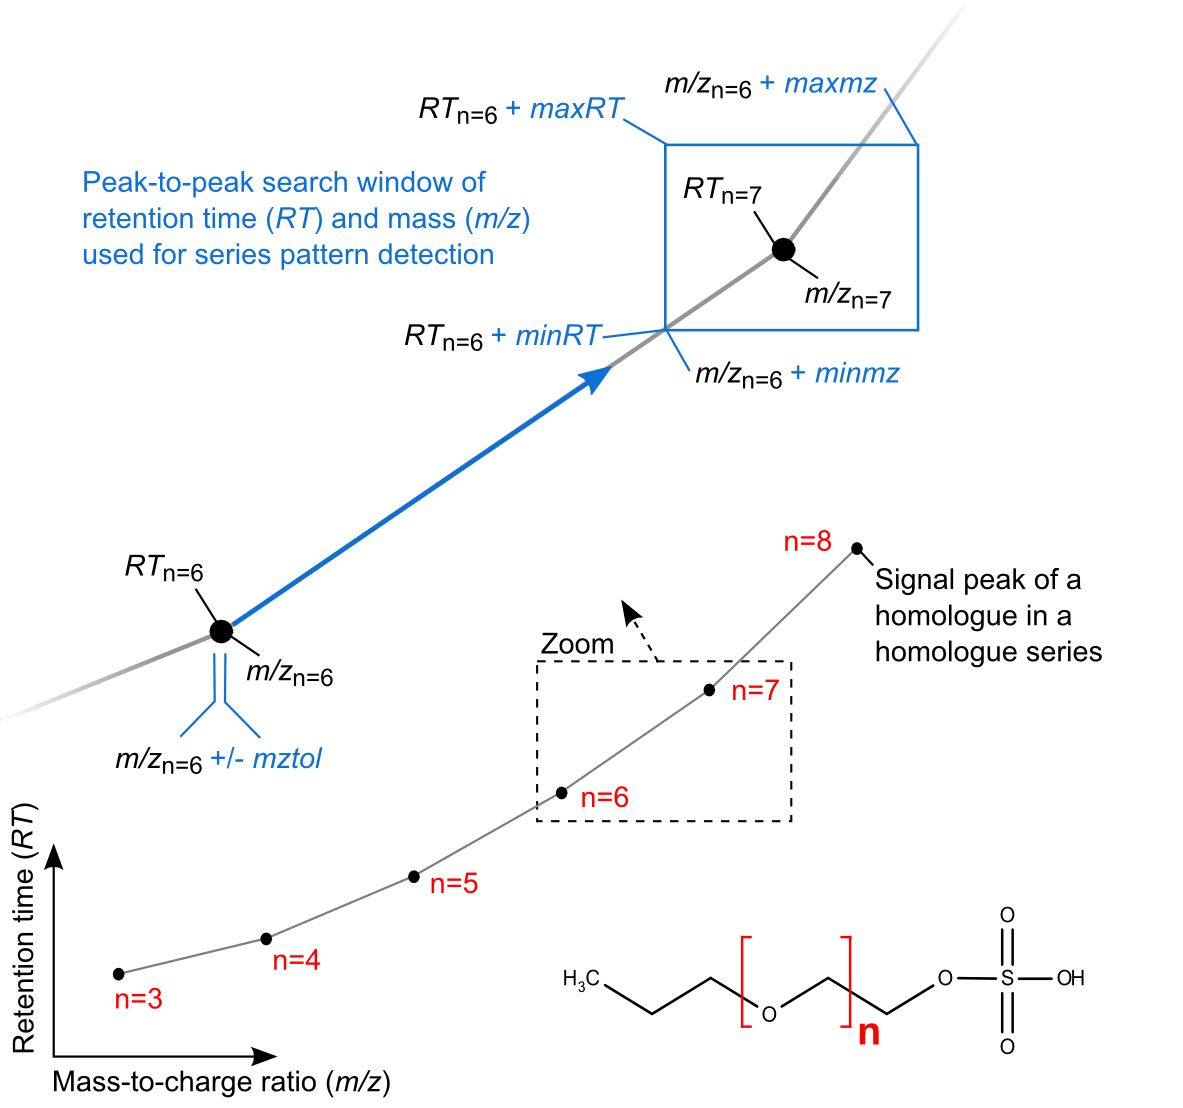
- The m/z accuracy (a.k.a mass accuracy) must be specified, termed mztol. This parameter can be either set as ppm or as an absolute value. Typical mztol values for ToF and Orbitrap MS instruments range in between 2 and 10ppm.
- The minimum and maximum mass range of the reoccurring units of a homologous series must be specified, termed minmz and maxmz, respectively. For example, when expecting units of both CH2 and CH2O, mass ranges must at least cover minmz = 14.0266 and maxmz=30.0106 at charge z=1. You may use www.enviPat.eawag.ch for a calculation of these ranges at the different charges.
- Changes in retention time from one series peak to the next are covered by lower and upper bounds minRT and maxRT. This parameter is mainly influenced by the characteristic of the homologues and by the chromatographic system. Note that minRT must be set to negative values if RT is expected to decrease in a homologous series.
The below depiction further illustrates these parameters for the homologous series of a surfactant (blue notation), containing six homologues and their LC-MS signal peaks (numbered in red). As illustrated, algorithm search windows to assort peaks into series are set relative to each preceding peak in a series, within the specified parameters.

Kindly note that calculations which consume more than two minutes of our server time will be aborted. It is likely that, e.g., too lose parameter restrictions were set in such a case, that the peak lists are too long or that the retention time of the uploaded .csv-file is given in minutes whereas the parameters minRT and maxRT are set in seconds.

